In my last post, I looked at the leavening effect that large cash balances have on PE ratios, especially in a low-interest rate environment. In making that assessment, I used a company with no debt to isolate the effect of cash, but many of the comments on that post raised interesting points/questions about debt.
The first point is that while cash acts as an upper for PE, debt can act as a downer, with increases in debt reducing the PE ratio, and that if we are going to control for cash differences in the market across time, we should also be looking at debt variations over the years.
The second is the question of which effect on PE dominates for firms that borrow money, with the intent of holding on to the cash. In this post, I will start by looking at debt in isolation but then move to consider the cross effects of cash and debt on PE.
Debt and PE: A simple illustration
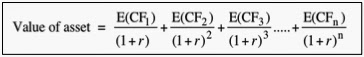
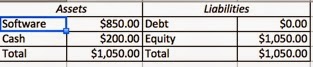
To examine the relationship between PE and debt, I went back to the hypothetical software firm that I used to evaluate the effect of cash on PE. Initially, I assume that the firm has no cash and no debt and is expected to generate $120 million in pre-tax operating income next year, expected to grow at 2% a year in perpetuity. Assuming that the cost of equity (and capital) for this firm is 10%, that the tax rate is 40% and that its return on equity (and capital) on new investments is 36%, the company's income statement and intrinsic value balance sheet are as follows:
![]()
Now, assume that this firm chooses to move to a 40% debt ratio with a pre-tax cost of borrowing of 4%. The effects of the debt on the are traced through in the picture below:
![]()
Note that the value of the business has increased from $850 million to $988.37 million, with the bulk of the value increase coming from the tax subsidies generated by debt.
The effects of borrowing show up everywhere, with almost almost every number shifting, and the effects at first sight seem to be contradictory. Higher debt raises the cost of equity but lowers the cost of capital, reduces net income but increases earnings per share and results in a lower PE ratio, while increasing the value per share. The intuition, though, is simple. Borrowing money to fund the business increases both the expected returns to equity investors (captured in the EPS increase) and the riskiness in those equity returns (pushing the PE ratio down) and at least at a 40% debt ratio, the benefits outweigh the costs. In fact, if you are able to continue to borrow money at 4% at higher debt ratios, the PE ratio will continue to drop and the value per share continue to increase as the debt ratio increases.
![]()
Note that at a 90% debt to capital ratio, the PE ratio drops to 2.75 but the value per share increases to $11.41. If it is sounds too good to be true, it is, because there are two forces that will start to work against debt, especially as the debt ratio increases. The first is that the rate at which you borrow will increase as you borrow more, reflecting the higher default risk in the company. The second is that at a high enough debt level, with high interest rates, the interest expenses may start to exceed your operating income, eliminating the tax benefits of debt. In the table below, I highlight the effects on PE and value per share of different borrowing rates:
![]() Numbers in red are declines in value/share
Numbers in red are declines in value/share
The breakeven cost of borrowing, at least in this example, is around 8.6%; if the company borrows at a rate that exceeds 8.6%, debt reduces the value per share. The effect on PE, though, is unambiguous. As you borrow more money, the PE ratio decreases and it does so at a greater rate, if the borrowing rate is high.
Debt, Cash and PE: Bringing it all together
Now that we have opened to the door to cash and debt separately, let's bring them together into the same company. A measure that incorporates both cash and debt is the net debt, which is the difference between the cash and debt balances of the company.
Net Debt = Total Debt - Cash and Marketable Securities
This number will be negative when cash balances exceed total debt, zero, when they offset each other, and positive, when debt exceeds cash. In the table below, I have estimated the PE ratio for the company with different combinations of debt ratios (from 0% to 50%) with cash ratios (from 0% to 50%), with debt borrowed at 4% and cash invested at 2%:
![]() Numbers in red are declines in value/share
Numbers in red are declines in value/share
Note that both the cash effect, which pushes up PE ratios, and the debt effect, which pushes down PE ratios, is visible in this table. Interesting, a zero net debt ratio (which occurs across the diagonal of the table) does not have a neutral effect on PE, with PE rising when both debt and cash are at higher values; thus the PE when you have no cash and no debt is 11.81, but it is 12.66 when you have 40% debt and 40% cash. Before you view this as a license to embark on a borrow-and-buy treasury bills scheme, note that the value per share effect of borrowing money and holding it as cash is negative; the value per share declines $0.22/share when you move from a net debt ratio of zero (with no debt and no cash) to a net debt ratio of zero (with 40% debt and 40% cash). Again, there is no mystery as to why. If you borrow money at 4% and invest that money at 2%, which is effectively what you are doing when cash offsets debt, you are worse off than you would have been if you had no cash and no debt. In fact, the only scenario where the value effect of borrowing money and buying T.Bills is neutral is when you can borrow money at the risk free rate but even in that scenario, the PE ratio still increases. In short, the cash effect dominates the debt effect and you can check it out for yourself by downloading the spreadsheet that I used for my computations.
Cash and Debt Effects on PE: US Stocks from 1962 to 2014
In my last post, I noted the difficulty with dealing with cash balances at financial service firms, where the cash serves a very different purpose than it does at non-financial service firms. That statement is even more applicable when it comes to debt, since debt to a financial service firm is less a source of capital and more raw material. Hence, I will focus entirely on non-financial service firms for this section. The first set of statistics that I will estimate relate to debt and cash. In the graph below, I look at cash as a percent of firm value (estimated as market capitalization plus total debt), total debt as a percent of that same value and the net debt ratio (the difference between total debt and cash, as a percent of value) for non-financial service firms in the US from 1962 to 2014.
![]() Raw data from Compustat: All money-making, non-financial service firms
Raw data from Compustat: All money-making, non-financial service firms
Note the median values for cash and debt are highlighted on the graph. In 2014, the cash holdings at non-financial service companies in the US amounted to 7.30%, higher than the median value of 7.23% for that statistic from 1962 to 2014, and the total debt was 24.20% of value, lower than the median value of 28.39 for that ratio from 1962 to 2014. Since cash pushes up PE ratios and debt pushes down PE ratios, the 2014 levels for both variables are biasing PE ratios upwards, relative to history.
Unlike the cash effect, which I was able to measure with relative ease by netting cash out of the market capitalization and the income from cash from the net income, the debt effect is messier to isolate. If you assume that cash is the only non-operating asset (i.e., that companies do not have cross holdings and other non-operating investments), the debt effect can be computed approximately. First, if cash and debt is zero for a company, and there are no other non-operating assets, the net income for that company will be its after-tax operating income (EBIT (1-tax rate)). Second, the value of the company, if it it had no cash and debt, can be approximated with its enterprise value, leading to the EV/EBIT(1-t) providing an approximate measure of what the earnings multiple would have looked like with no cash and no debt. (The enterprise value does include the value effect of debt and is hence not a clean measure of what the value would have been, if the firm had no debt and no cash.)
Debt Effect = EV/ EBIT (1-t) - Non-cash PE
To estimate these numbers for my sample, I used the average effective tax rate each to compute the after-tax operating income in that year, in recognition of the reality that US companies would not be paying the marginal tax rate on taxable income, even if they had no interest expenses. The graph below summarizes the cash and debt effects on stocks from 1962 through 2014:
![]() Source: Compustat; All money-making, non-financial service US firms
Source: Compustat; All money-making, non-financial service US firms
At the end of 2014, the PE ratio was 17.73, the non-cash PE was 16.05 and the EV/EBIT(1-t) was 19.44. So, what do these numbers mean? All three measures are higher than the median values over the last 55 years, which would be ammunition you could use to argue that stocks are overvalued. However, as I noted in my post on PE ratios last year, the treasury bond rate, at 2%, is also much lower than the historic norm, and if you don't buy into the bubble story, could be used to explain the higher multiples. I don't this post is the forum for examining the heft of these arguments, but I did try to provide my views in this post last year on bubbles.
PE Ratios: Three Rules for the road
Like most investors, I like the simplicity and intuitive feel of PE ratios, but they are blunt instruments that can get us into trouble, when used casually. A low PE ratio can be indicative of cheapness, but it can also be the result of high debt ratios and low or no cash holdings. Conversely, a high PE ratio can point to over priced stocks, but it can be caused by high cash balances and low debt ratios. Based on the last two posts, I would suggest three simple rules for the use of PE ratios.
- When comparing PE ratios across companies, don't ignore cash holdings and debt. As the diversity of companies within sectors increases, the old notion of picking the lowest PE stock as the winner is increasingly questionable, since you may be choosing most highly levered company in the sector.
- When comparing PE ratios across time, don't ignore cash holdings and debt. In these last two posts, I have noted the ebbs and flows in both cash as a percent of firm value and debt as a percent of value across time, sometimes due to shifts in the numerator (cash and debt values changing) and sometimes due to shifts in the denominator (market value of equity changing). Whatever the reasons, these shifts can affect the PE ratios for the market, making it look expensive when cash balances are high and debt ratios are low.
- Any corporate action that changes the cash or debt as a percent of value will change the PE ratio. Consider a company that has a large cash balance and is planning on using that cash to buy back stock. Even if nothing else changes, the PE ratio for the company should decrease after the buyback, as (high PE) cash leaves the company. Thus, the practice of forecasting earnings per share after buybacks and multiplying those earnings per share by a constant PE will overstate value. This effect will be even more pronounced, if the company borrows some or all of the money to fund the buyback, since a higher debt ratio will also push down the PE even further.
Finally, if you are at the receiving end of an investing pitch (that a stock or market is cheap or expensive), based just on PE ratios, you should be skeptical, no matter how credentialed the person making the pitch may be, and do your own due diligence.
Spreadsheets
Debt, Cash, PE and Value: An intrinsic value
Datasets
Debt, Cash and Earnings Multiples: US non-financial service stocks - 1962-2014


 Numbers in red are declines in value/share
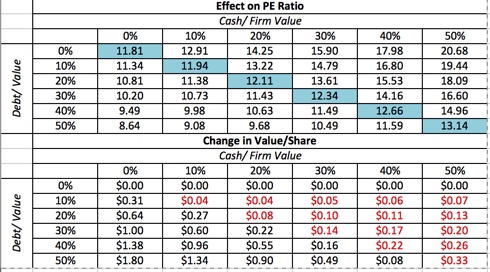 Numbers in red are declines in value/share
 Raw data from Compustat: All money-making, non-financial service firms
 Source: Compustat; All money-making, non-financial service US firms